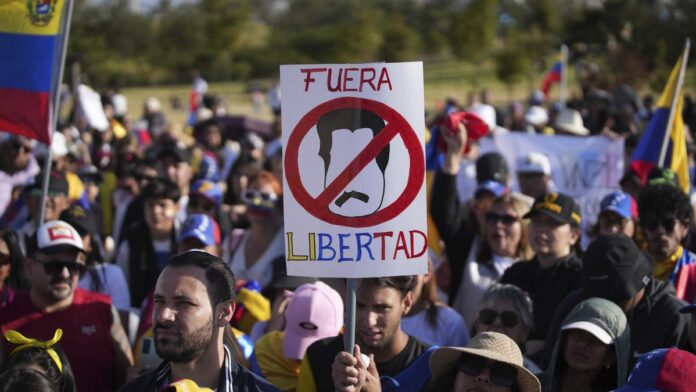
Venezuelan nationals protest against the results of their country’s presidential election, in Quito, Ecuador, Saturday, Aug. 3, 2024
| Photo Credit: AP
On July 28, Venezuela’s President Nicolas Maduro returned to power after a controversial election, whose results have been disputed by the Opposition and several countries. The unpopularity of Mr. Maduro’s regime is not under question as he oversaw an economy that descended into a free fall in his 11 years in power. The country’s annual inflation rate skyrocketed to five digits, along with shortages of basic supplies. It slid down the democracy index and touched new highs on bribery indices. Humanitarian and economic conditions have triggered a mass exodus, with as many as 7.7 million Venezuelans fleeing the country.
Chart 1 shows how Venezuela’s GDP (in current prices) started declining since Mr. Maduro’s ascent to power in 2013. According to the IMF, Venezuela’s real GDP saw the most protracted contraction in modern history during the last decade. Between 2013 and 2021, the economy contracted by 75%, the largest for any country not at war.
Chart appears incomplete? Click to remove AMP mode
Chart 2 plots Venezuela’s annual inflation rate. The country’s inflation spiralled to a peak of 65,374% resulting in hyperinflation in 2018 and remained in more than three digits for nine years.
Chart 3 shows how Venezuela fares on two indices maintained by the V-dem (Varieties of Democracy) Institute — the liberal democracy index and the executive corruption index.
Since 1999 — which heralded the era of Chavismo with Mr. Maduro’s predecessor, the late Hugo Chavez, coming to power — the country dropped on the liberal democracy index and underwent a rise on the corruption index. As of 2023, V-dem classifies the country as an electoral autocracy. Mr. Chavez’s rise coincided with a popular movement against the entrenched two-party system which was seen as failing to empower the masses. His regime sought to redistribute revenues from its flourishing petroleum extraction industry into welfare and this ensured that the country’s dependence on this industry became even more entrenched.
Venezuela sits on the world’s largest crude reserves. As Chart 4 shows, Venezuela’s petroleum exports formed about 80% of the country’s exports and remained in the range, 70% to 96%, between 1960 and 2023, making the country a “petrostate”. Petroleum exports also amount to 14% of the country’s GDP (as of 2023) and until 2019 remained over and above the 20% mark.
Chart 4 shows Venezuela’s petrol exports as a share of total exports and GDP (in %).
However, the production of crude oil has reduced significantly over time. Compared to 1973, when the country was producing 3.36 million barrels a day, the figure slipped to 0.78 million in 2023 (Chart 5). The number of active oil rigs in the country fell from 221 in 2014 to just three in 2023. Venezuela was the highest producer of crude among OPEC countries until 1969. But as of 2023, it ranks 9th in crude production. The drastic production cuts are directly linked to the sanctions imposed by the Donald Trump-led U.S. regime in 2017, a time when oil prices recovered globally.
Chart 5 shows Venezuela’s crude production (in 1,000 barrels a day), and active oil rigs against the nominal price of oil over time.
For many years, the trend of Venezuela’s exports and imports of goods and services followed that of oil prices (Chart 6). However, the current spike in oil prices has not seen a commensurate rise in exports and imports due to the imposition of sanctions by the U.S. Since 2023, following the Barbados agreement, the U.S. eased some of its sanctions and this allowed an increase in exports. However, the subsequent measures by the Mr. Maduro regime to ban Opposition candidates resulted in a re-imposition of sanctions.
Chart 6 shows Venezuela’s exports ($ million) and imports ($ million) against the oil prices ($/bb)
Source: OPEC, IMF, V-Dem
Also read: Nicolas Maduro | Chavism’s designated successor
#Venezuela #Maduro #authoritarianism #economic #chaos #Data
